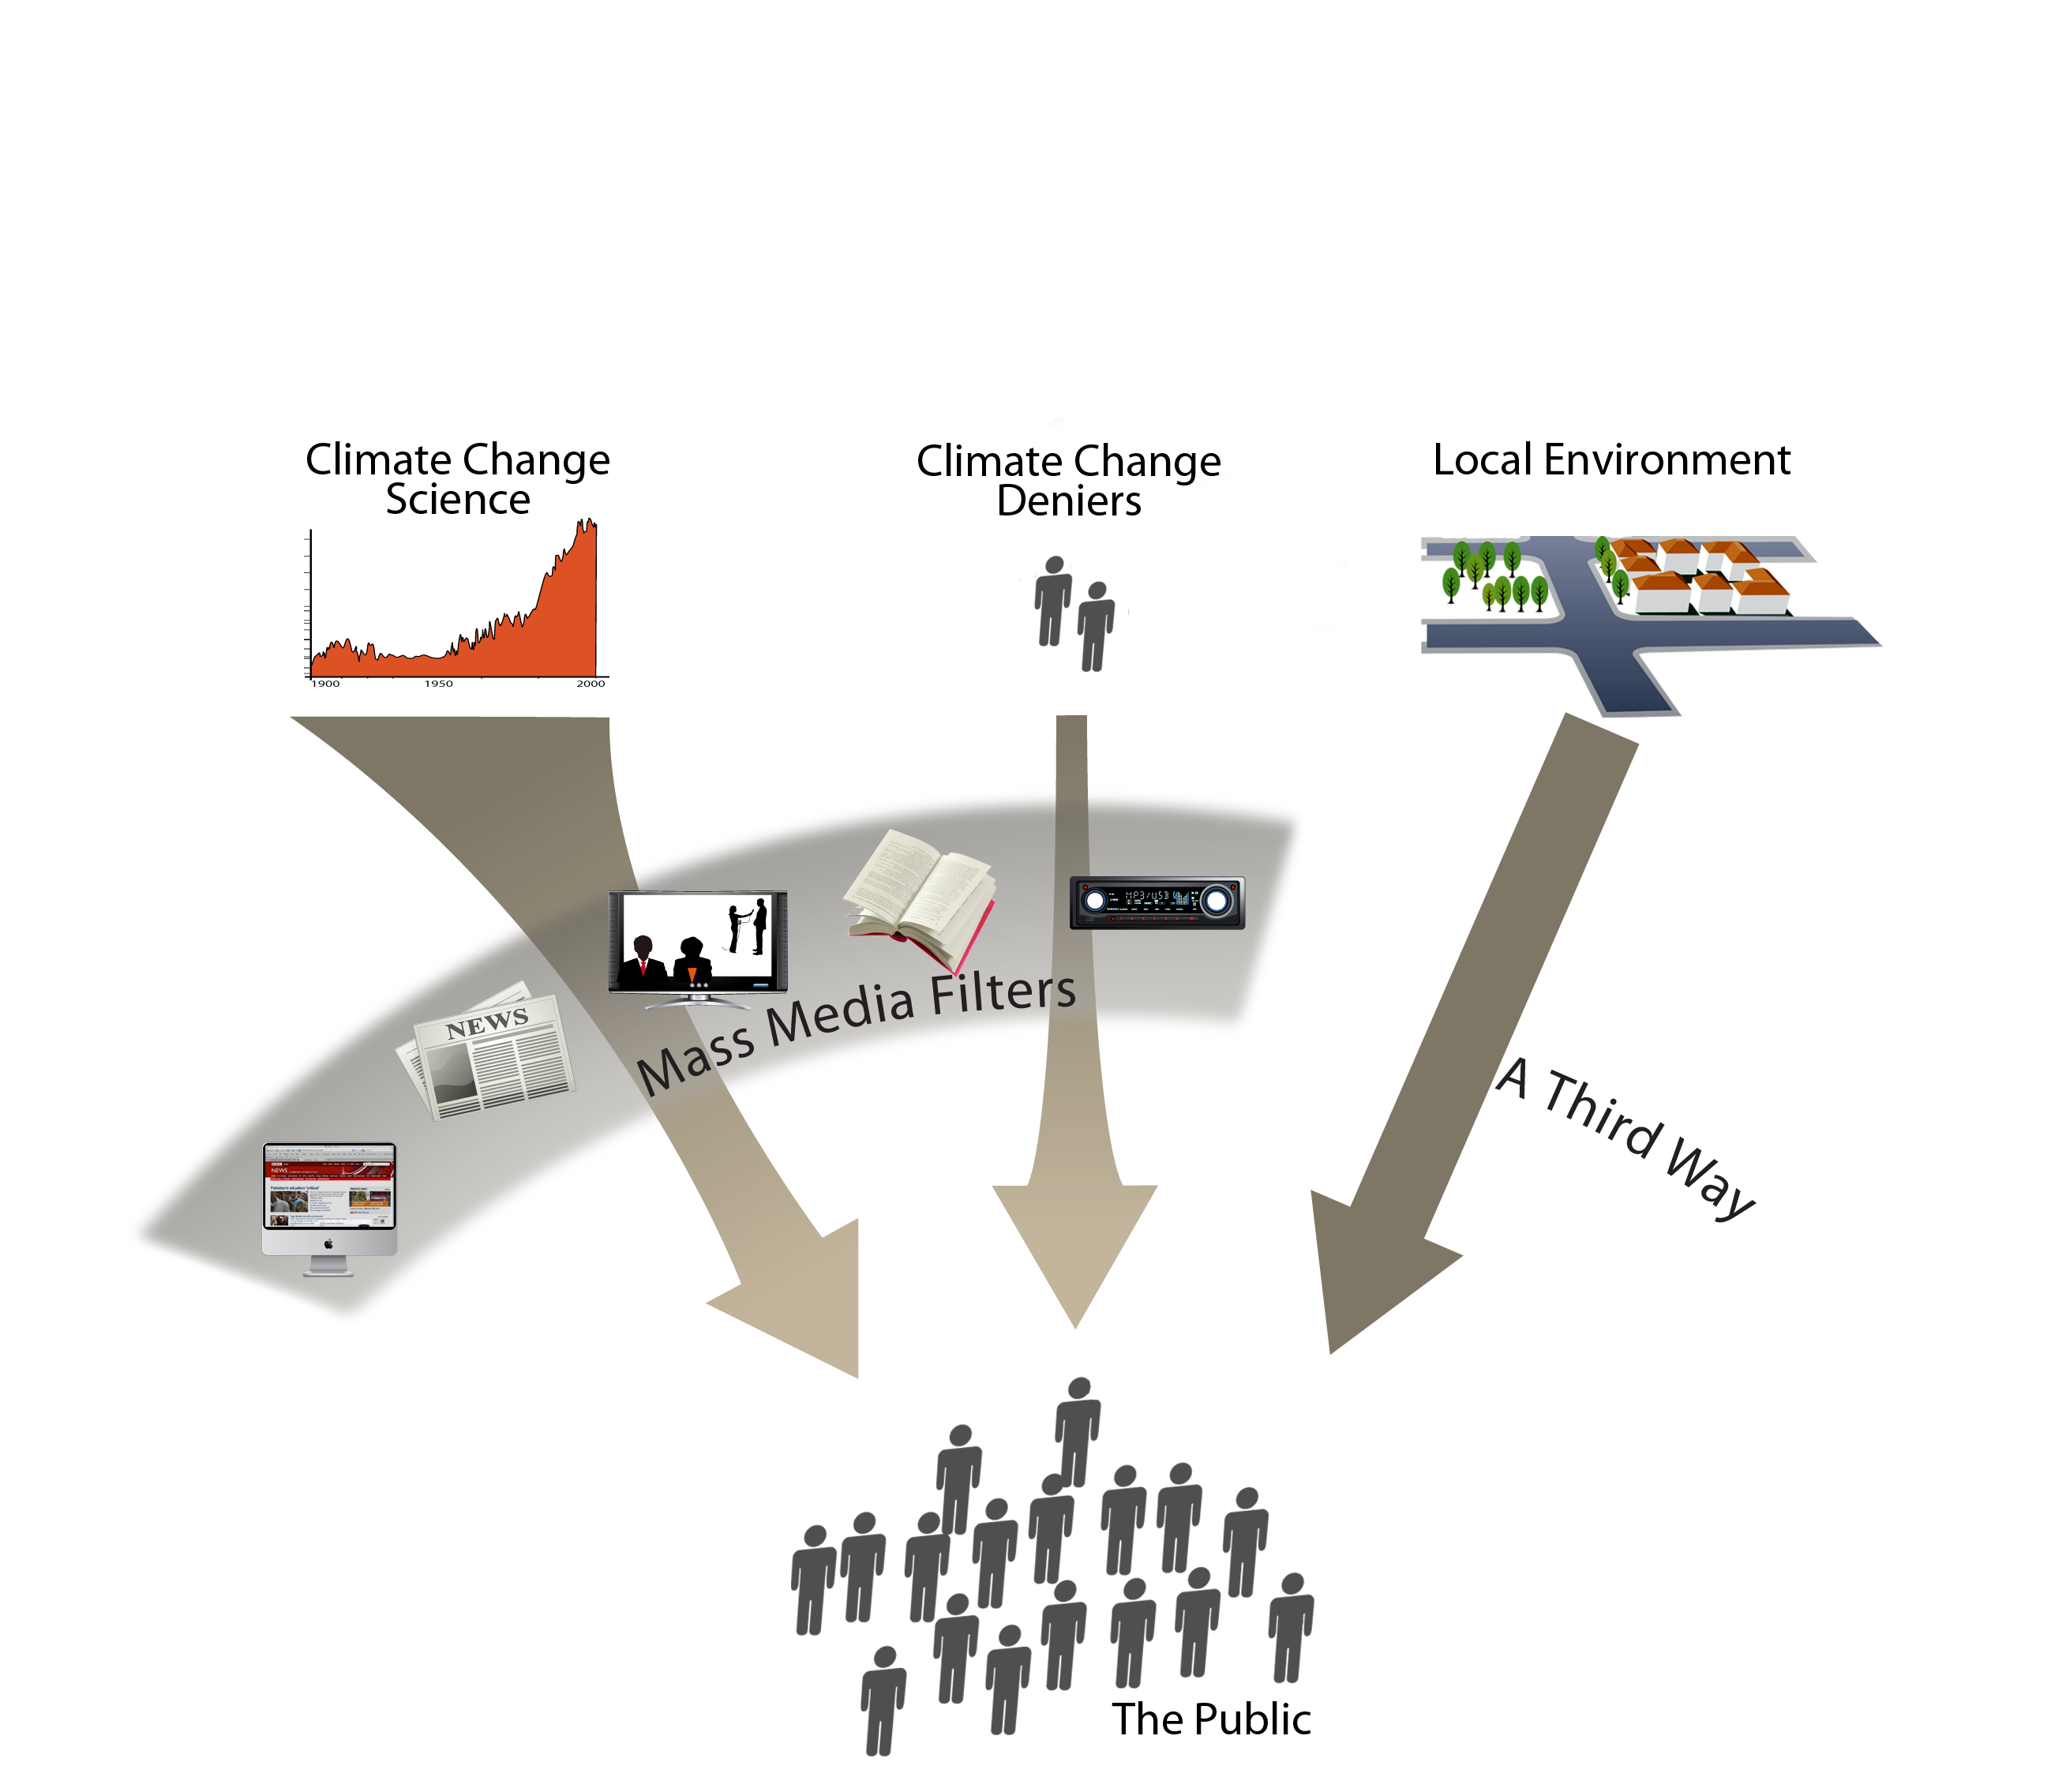
If you have had a chance to read some of our previous blog posts, you will likely have noted that our discussion of climate change focuses heavily on people’s perception of it.
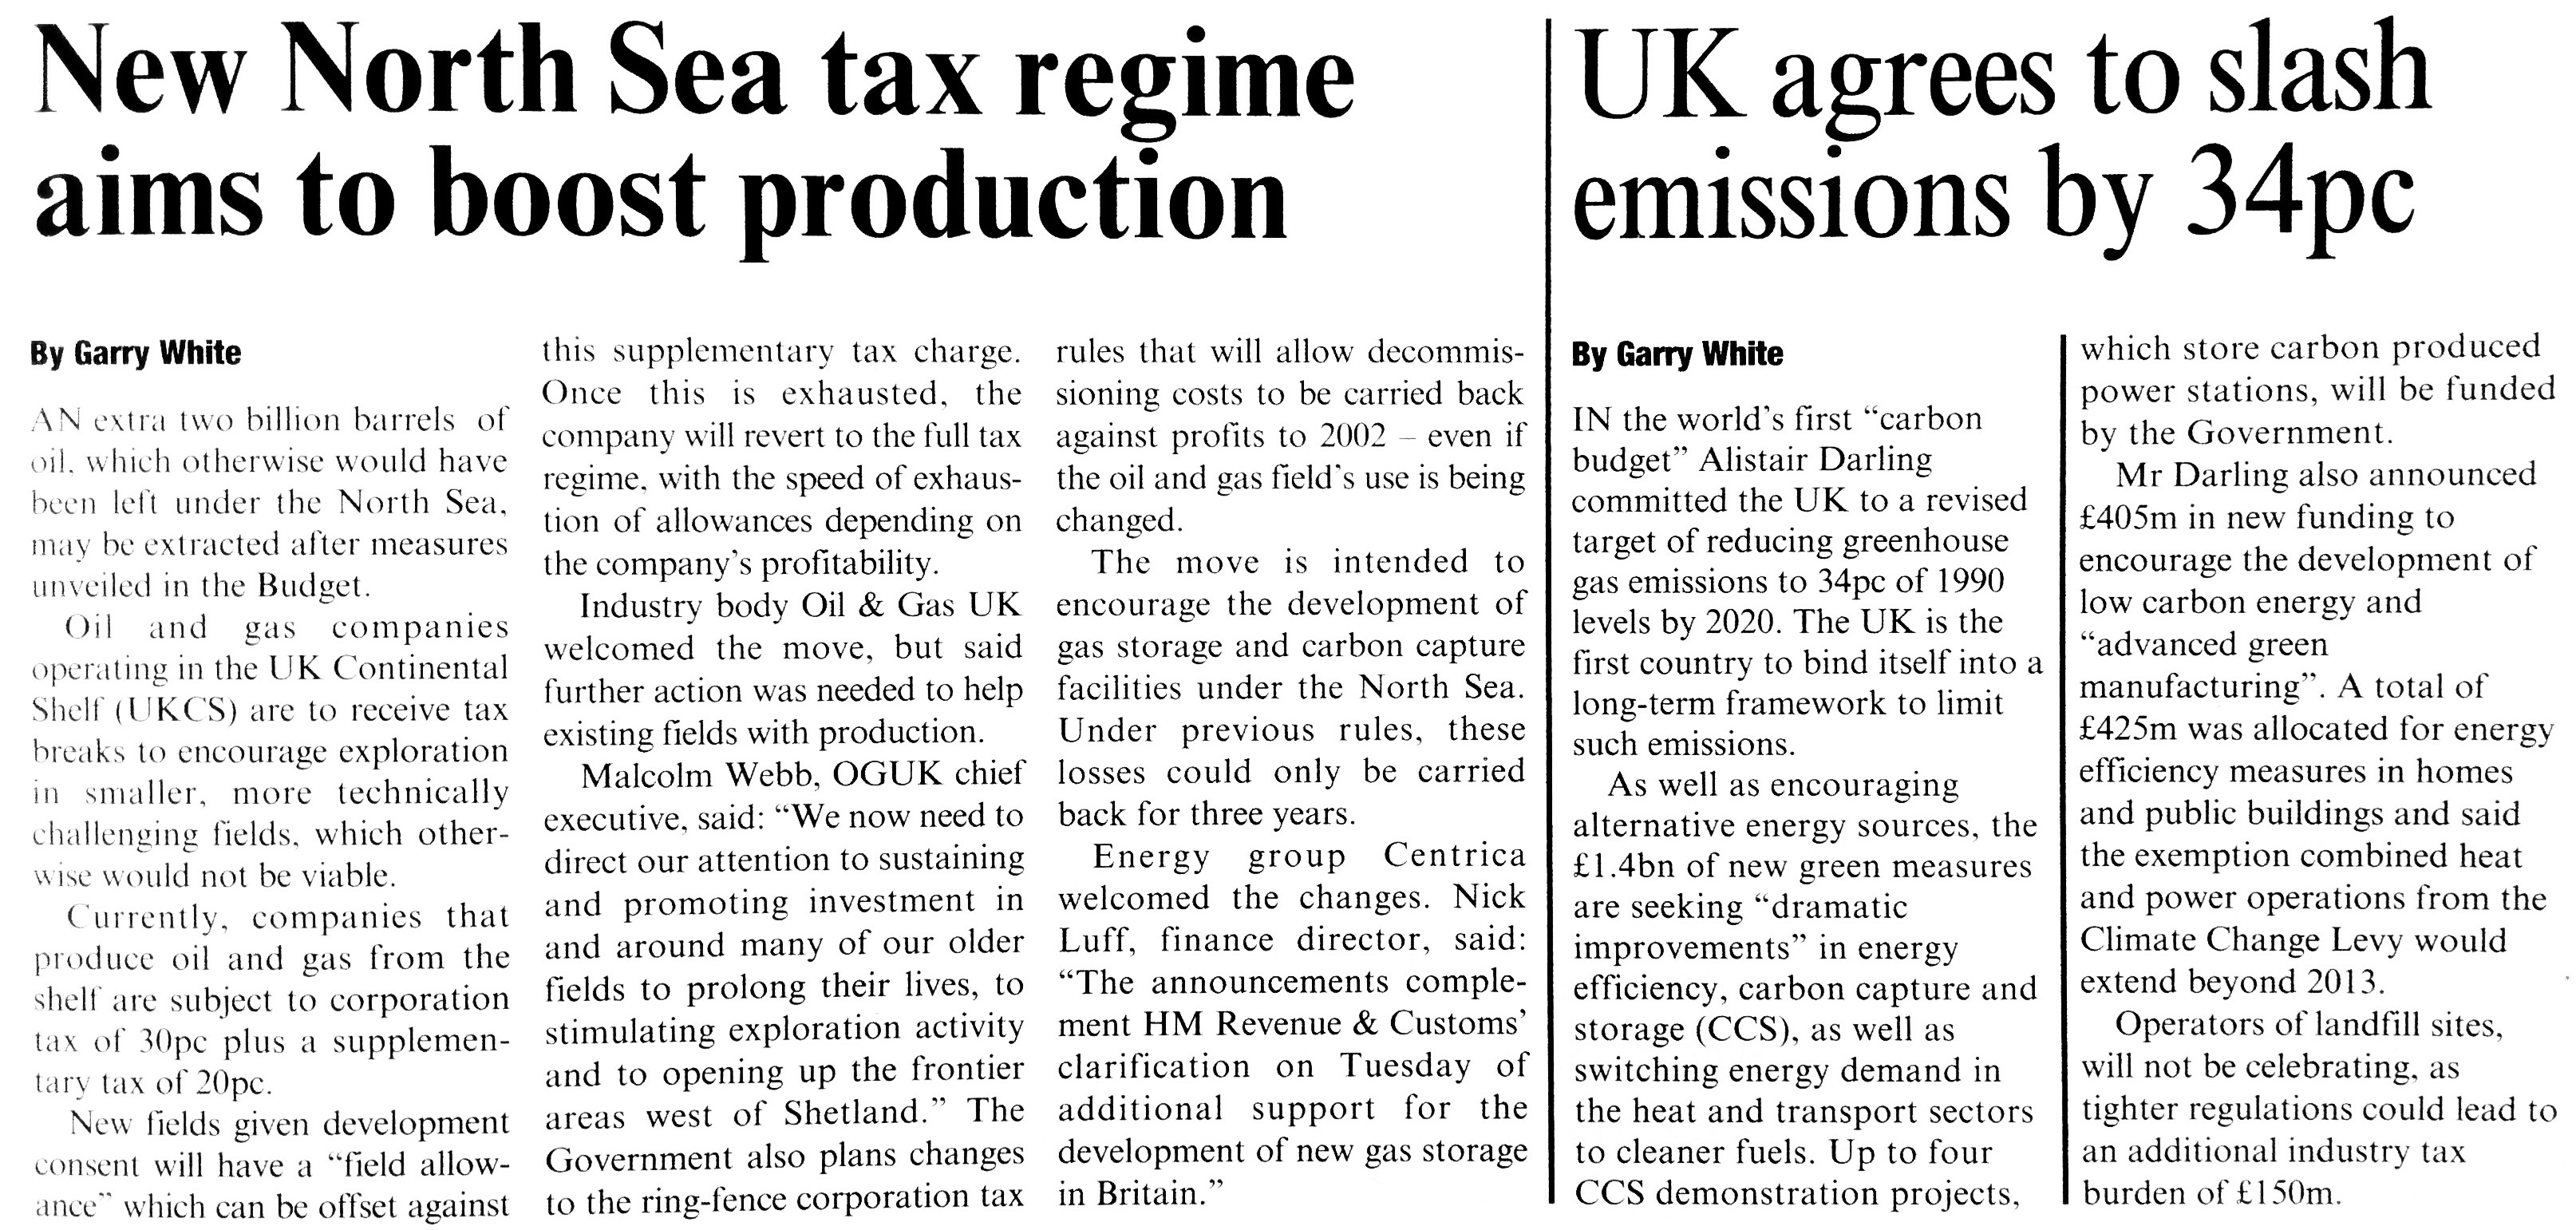
We have discussed how climate change information reaches people through a number of filters controlled by different media channels, and argued that your surrounding landscape may provide the most direct and impartial source of information on climate change.
At this point, you might be asking yourself: why are we placing so much importance in individuals’ perception of climate change?
With climate change, what you see is what you get (as in mentally ‘getting it’). You can only really understand it if you see for yourself.
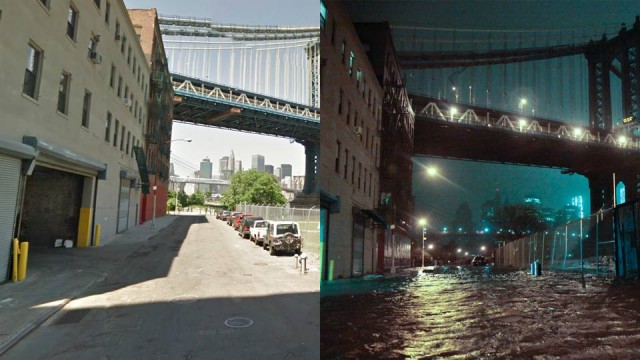
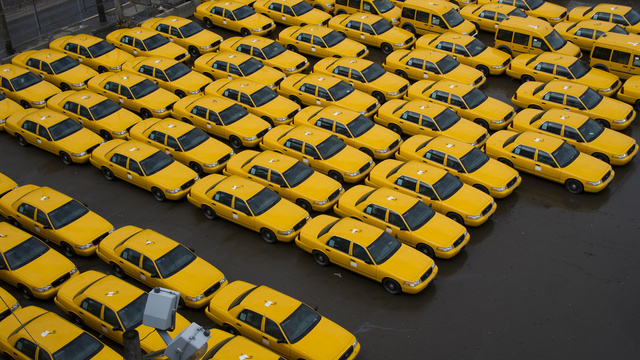
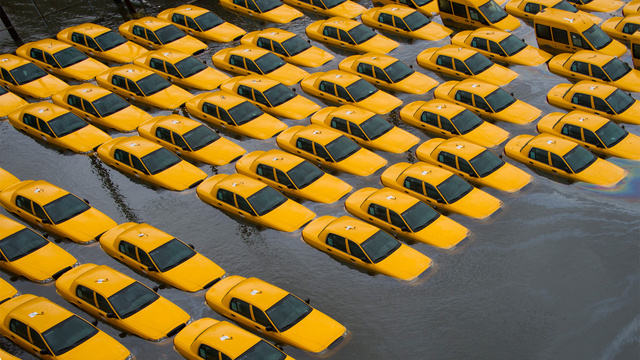
Photo: Google Earth, Bebeto Matthews/AP
People who lived through Hurricane Sandy saw it for themselves; they get it. They saw their city change right before their eyes, in an extreme weather occurrence that is indicative of and produced by climate change.
AP Photo/Charles Sykes
But most of us (in the more developed world at least) haven’t yet had such a traumatic experience arising from an extreme event related to climate change.
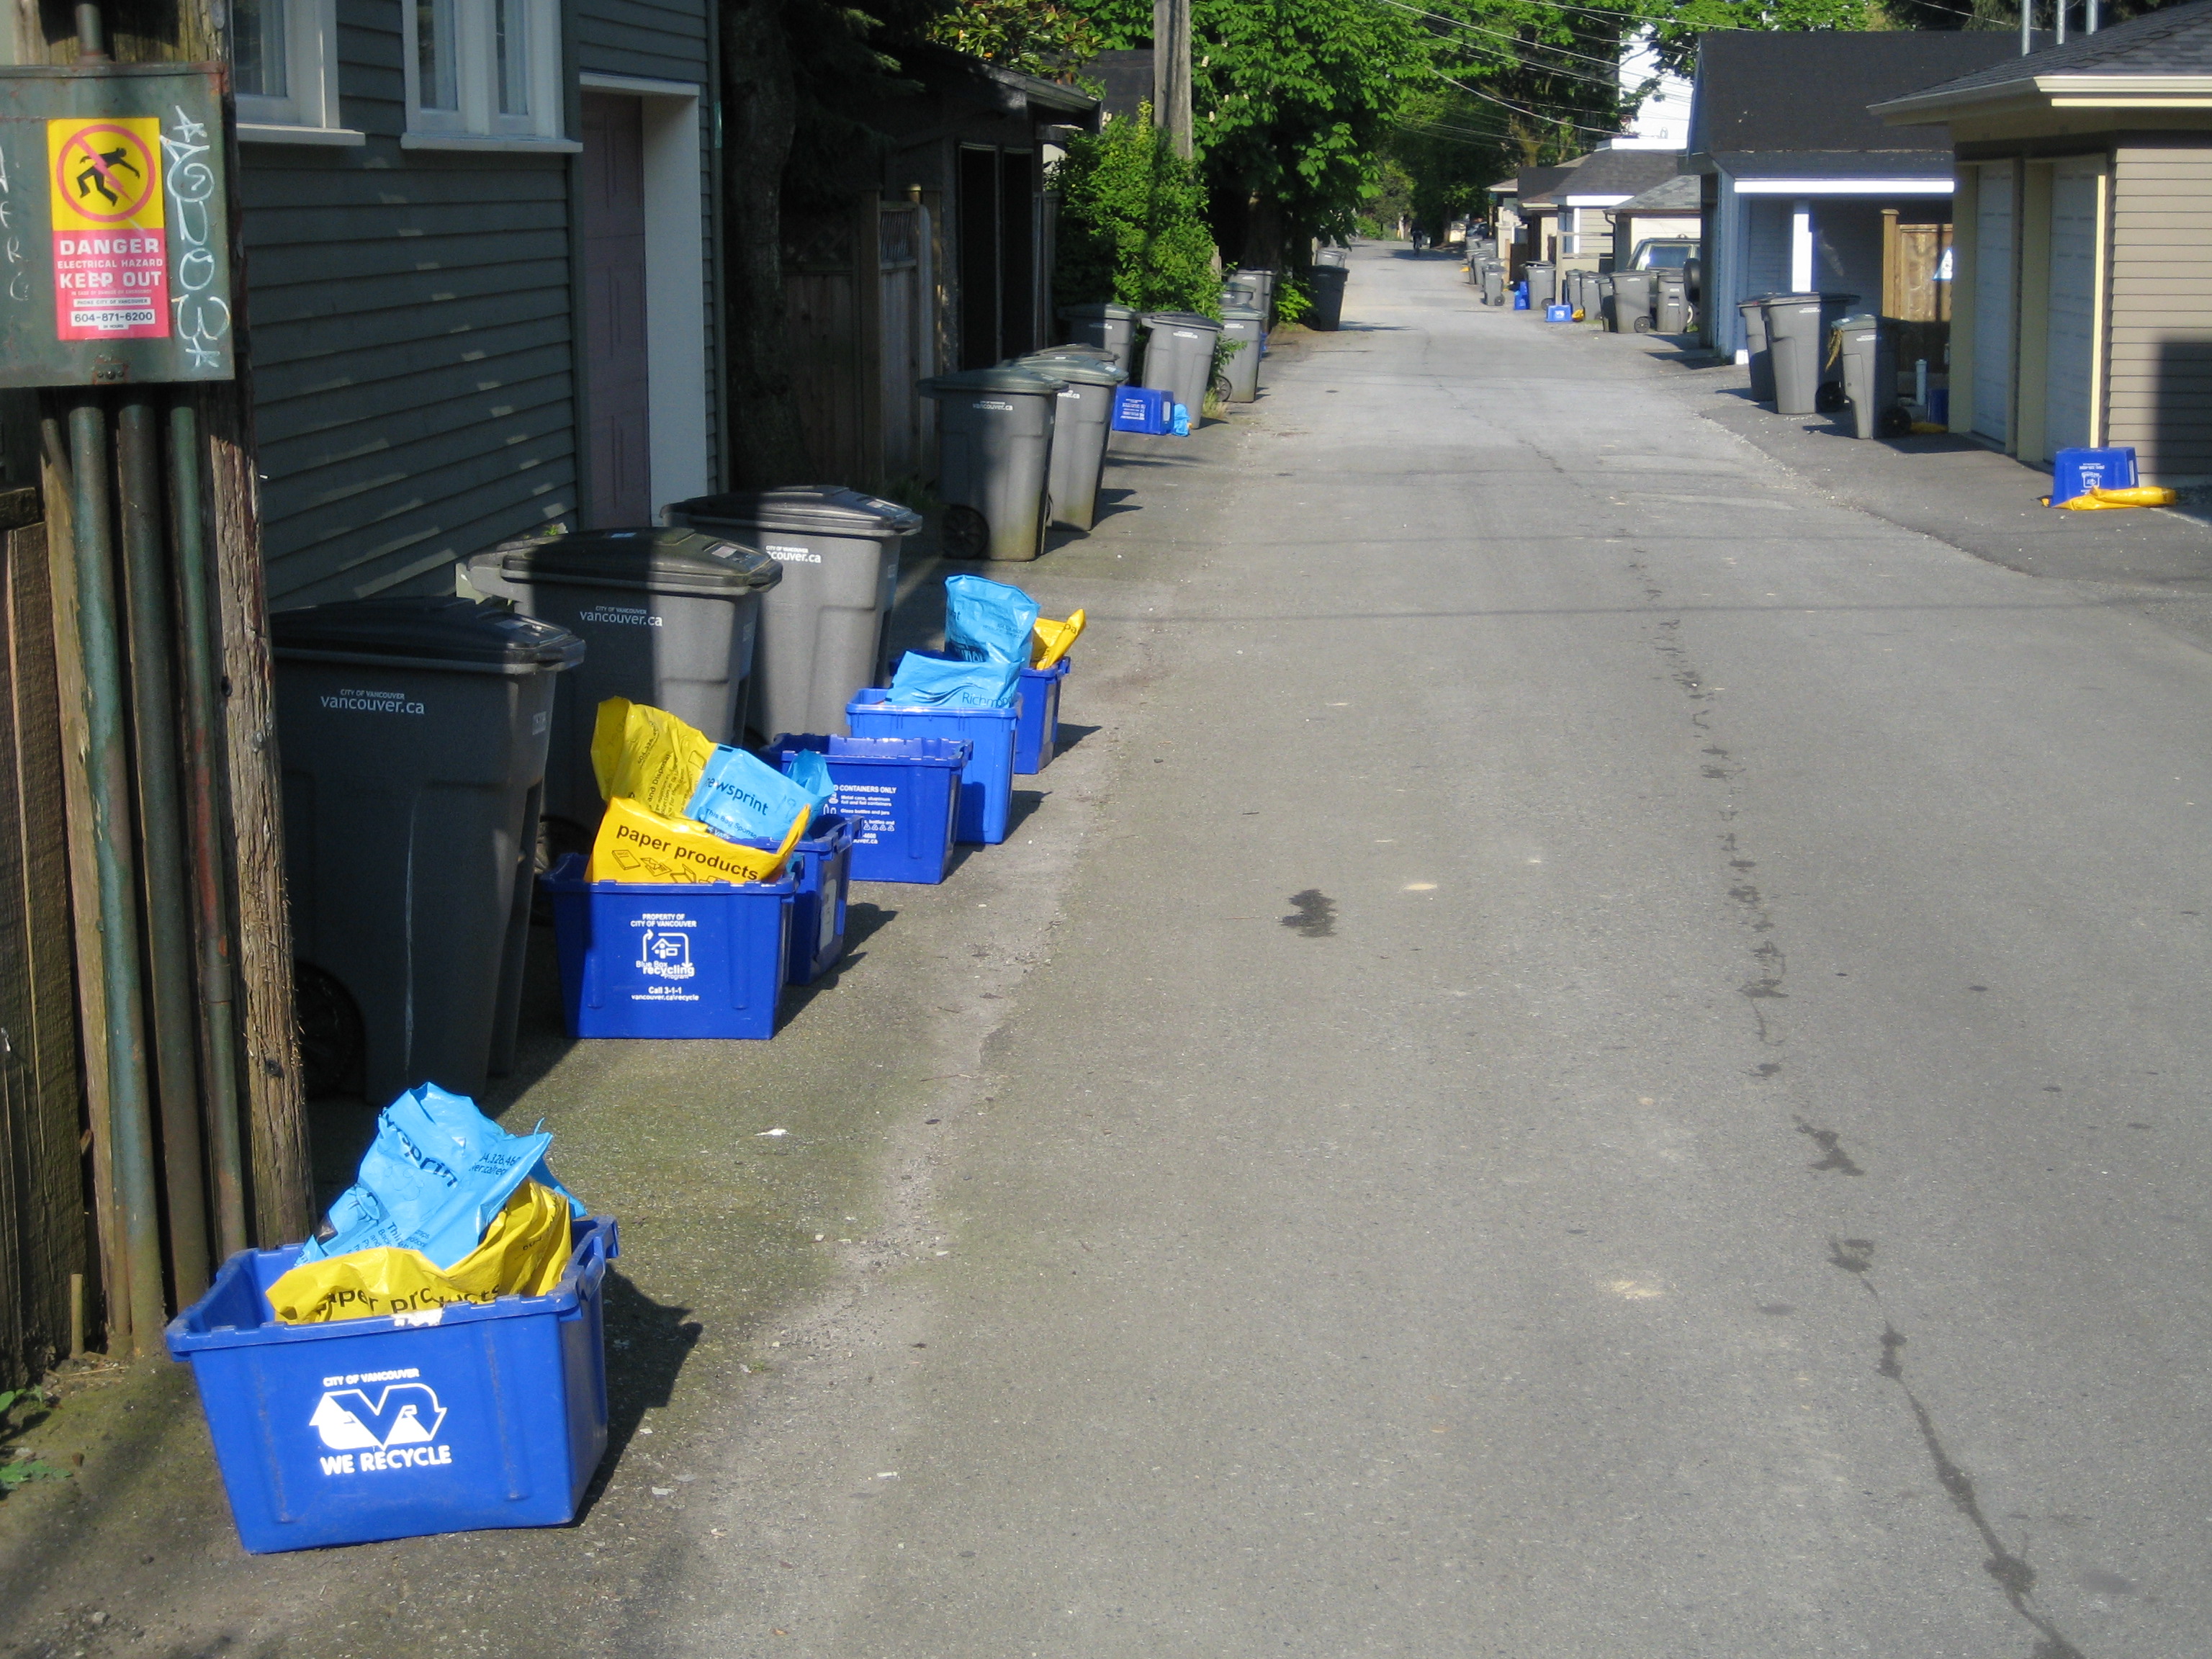
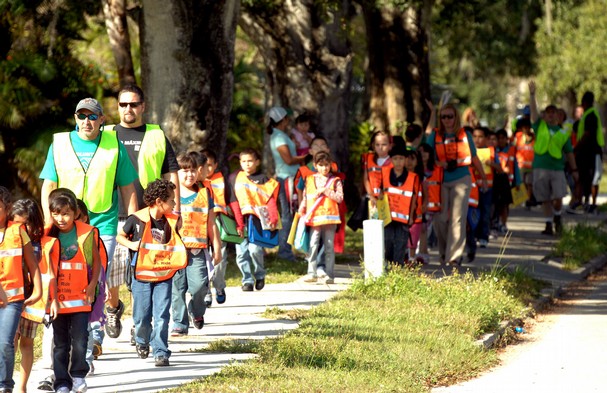
We can instead look for more subtle signals of climate change around us, as shown in Chapters 5-9 of Visualizing Climate Change: a sort of “Field Guide to Local Climate Change”. In an upcoming blog we will provide you with a quick guide to identifying sources of carbon emissions around you, in your own city, neighbourhood, and home.
We can also use imagery to inform and motivate ourselves. We live in a highly visual modern culture – where pictures are shared with the greatest ease, allowing millions of people to view a Instagram post, a Pinterest pin or a Facebook album within seconds.
Al Gore might be the most well-known reference for this. His documentary, An Inconvenient Truth, made use of extensive visualizations, maps, and graphs to demonstrate the urgency with which we must respond to climate change. However, while An Inconvenient Truth was successful in increasing awareness of climate change for many people, it seemed to fail in promoting action against climate change.
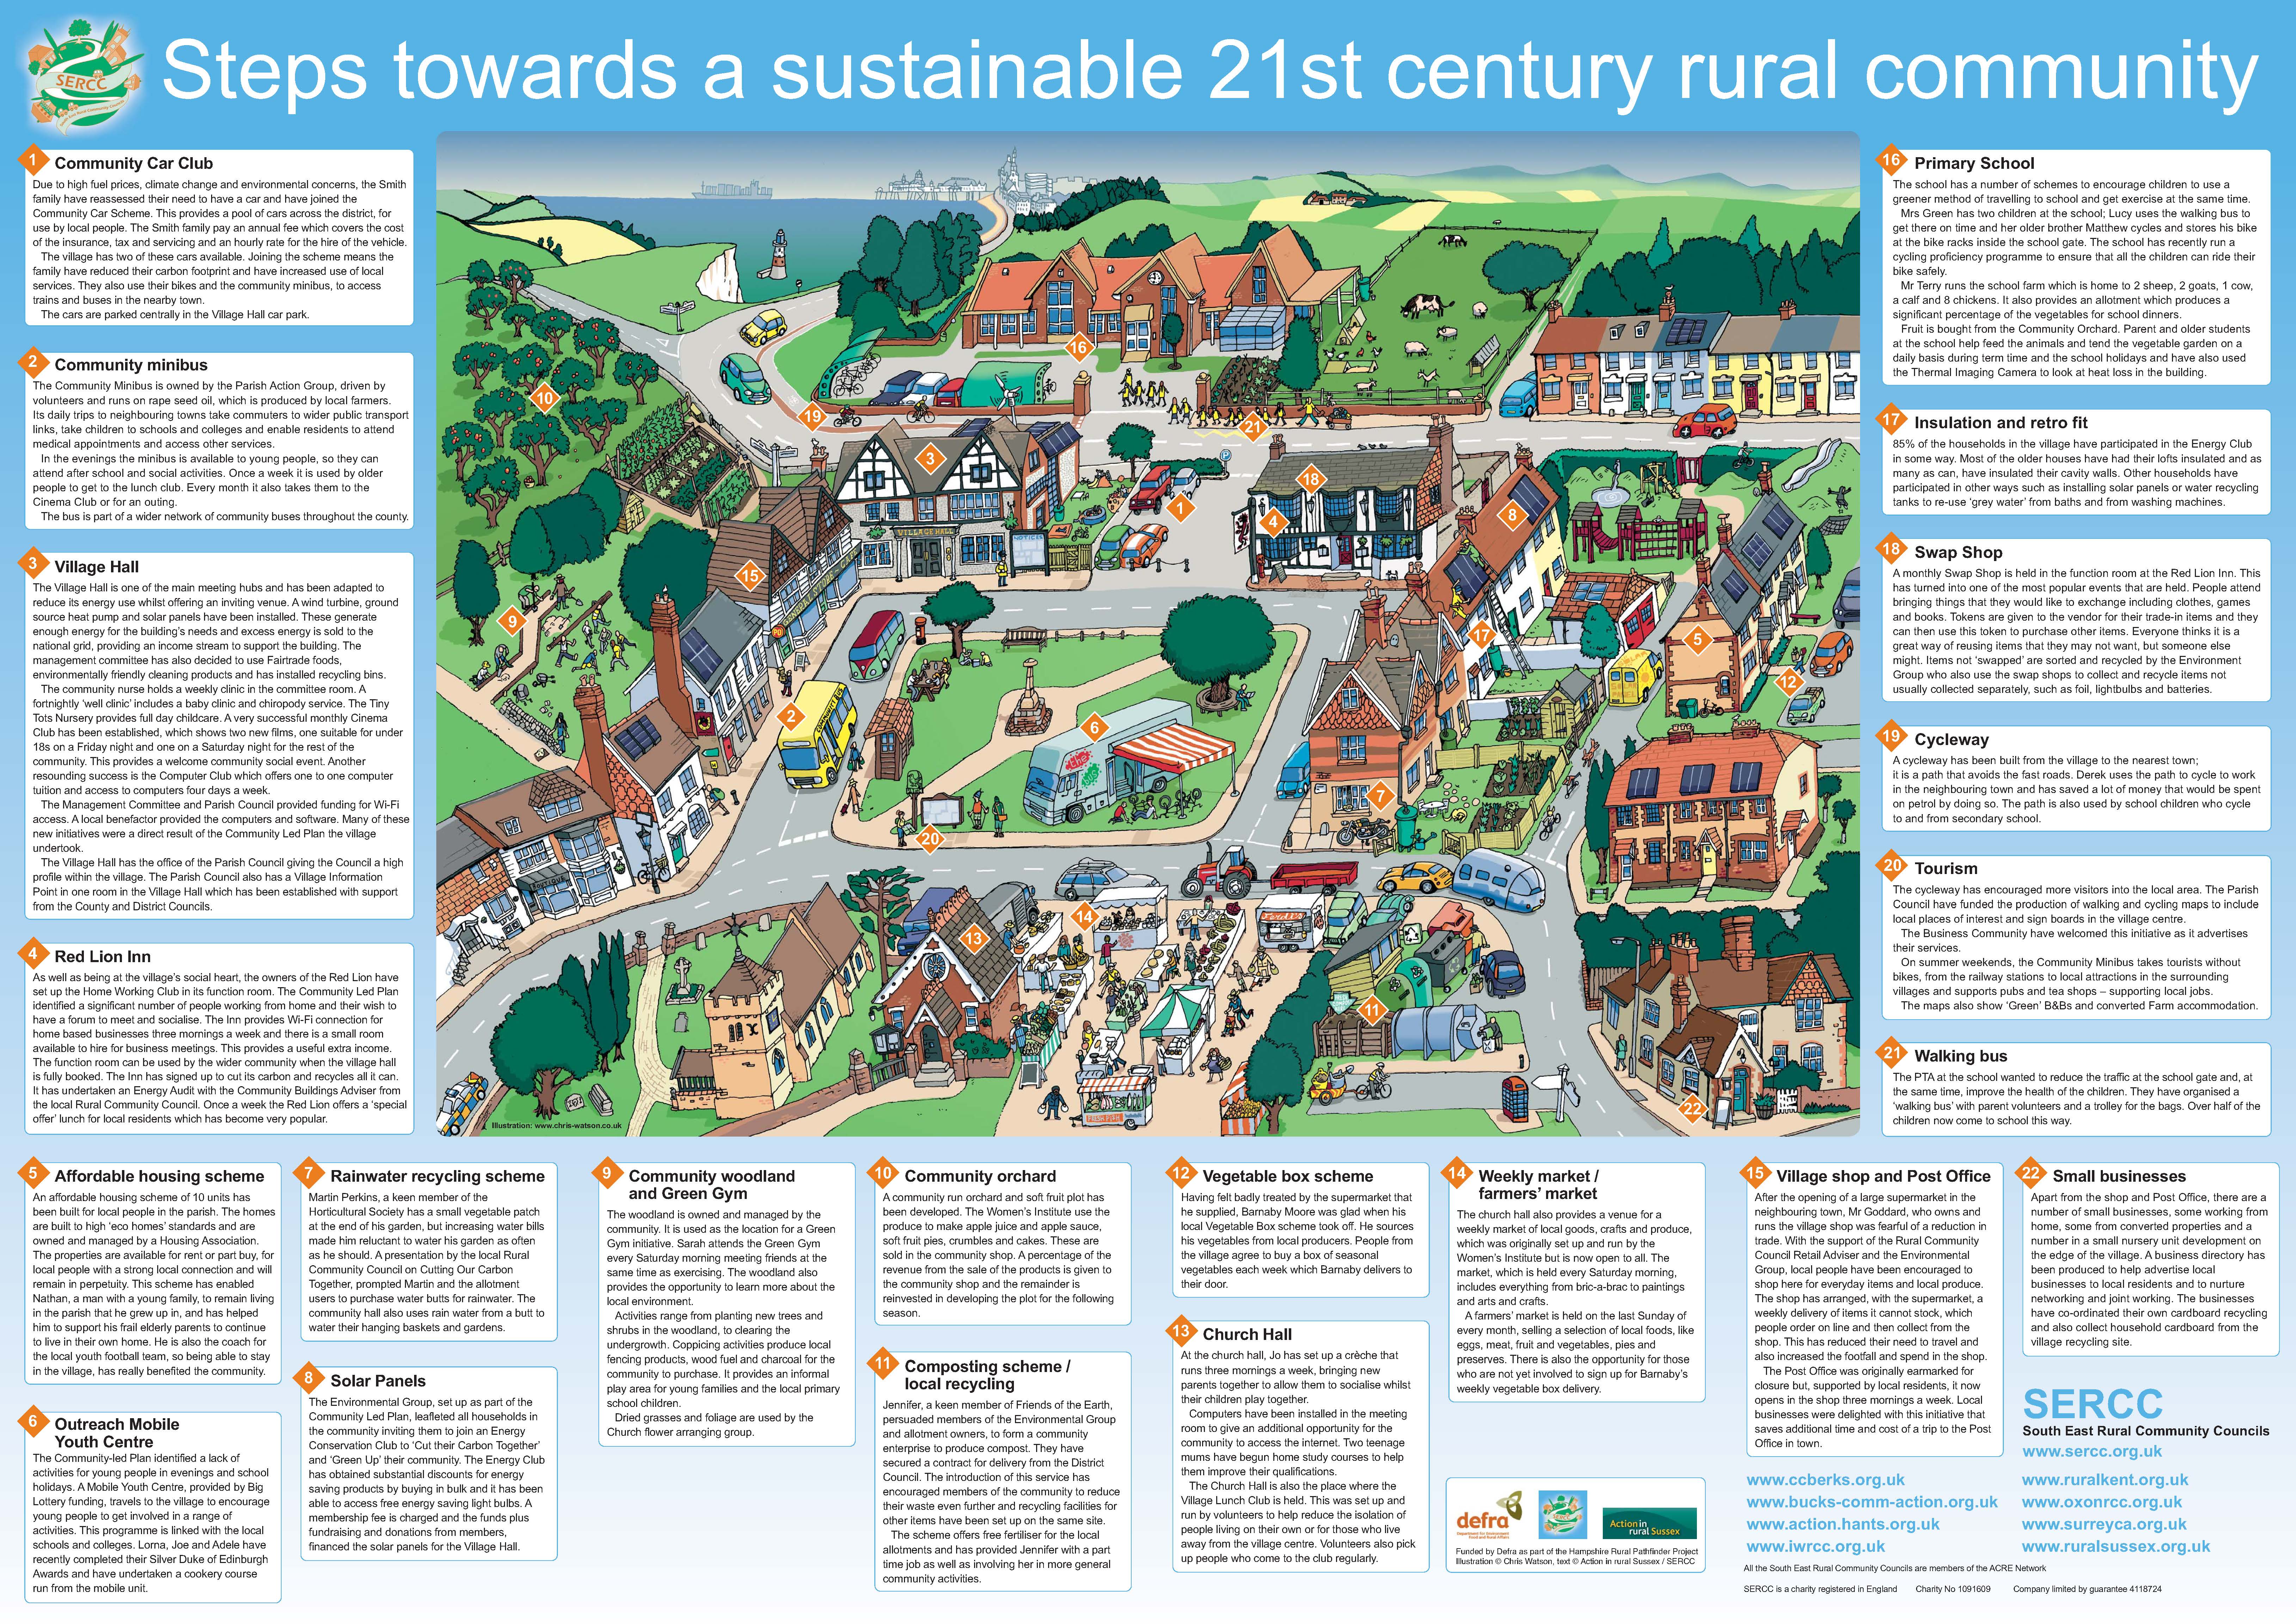
The key, some have argued, is to make climate change local: to make climate change visible and meaningful in your own city, neighbourhood and home. An Inconvenient Truth applies visualization techniques to global cities and iconic locations which many viewers know of, but which they may not relate to or care about.
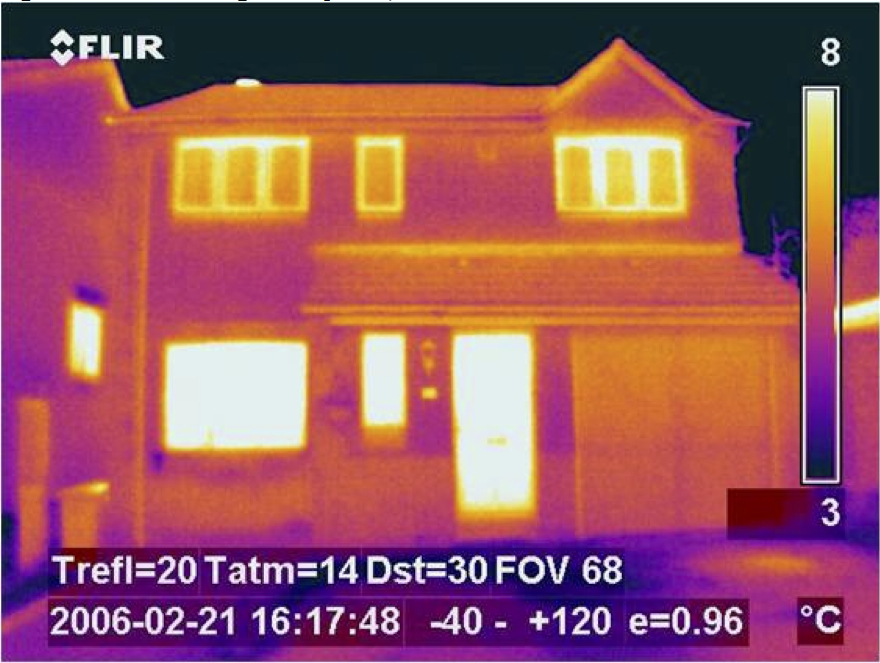
Planners and local officials in the Western USA reported that “local scepticism and lack of urgency [towards climate change] may be due to few visible impacts in their communities that residents feel are attributable to climate change”. (Flint: 2009, citing Metz and Below (2009)) Studies show that “householders grossly over-estimate the resources used by visible devices, such as lighting, and greatly underestimate less visible resource consumption” such as water heaters and furnaces.
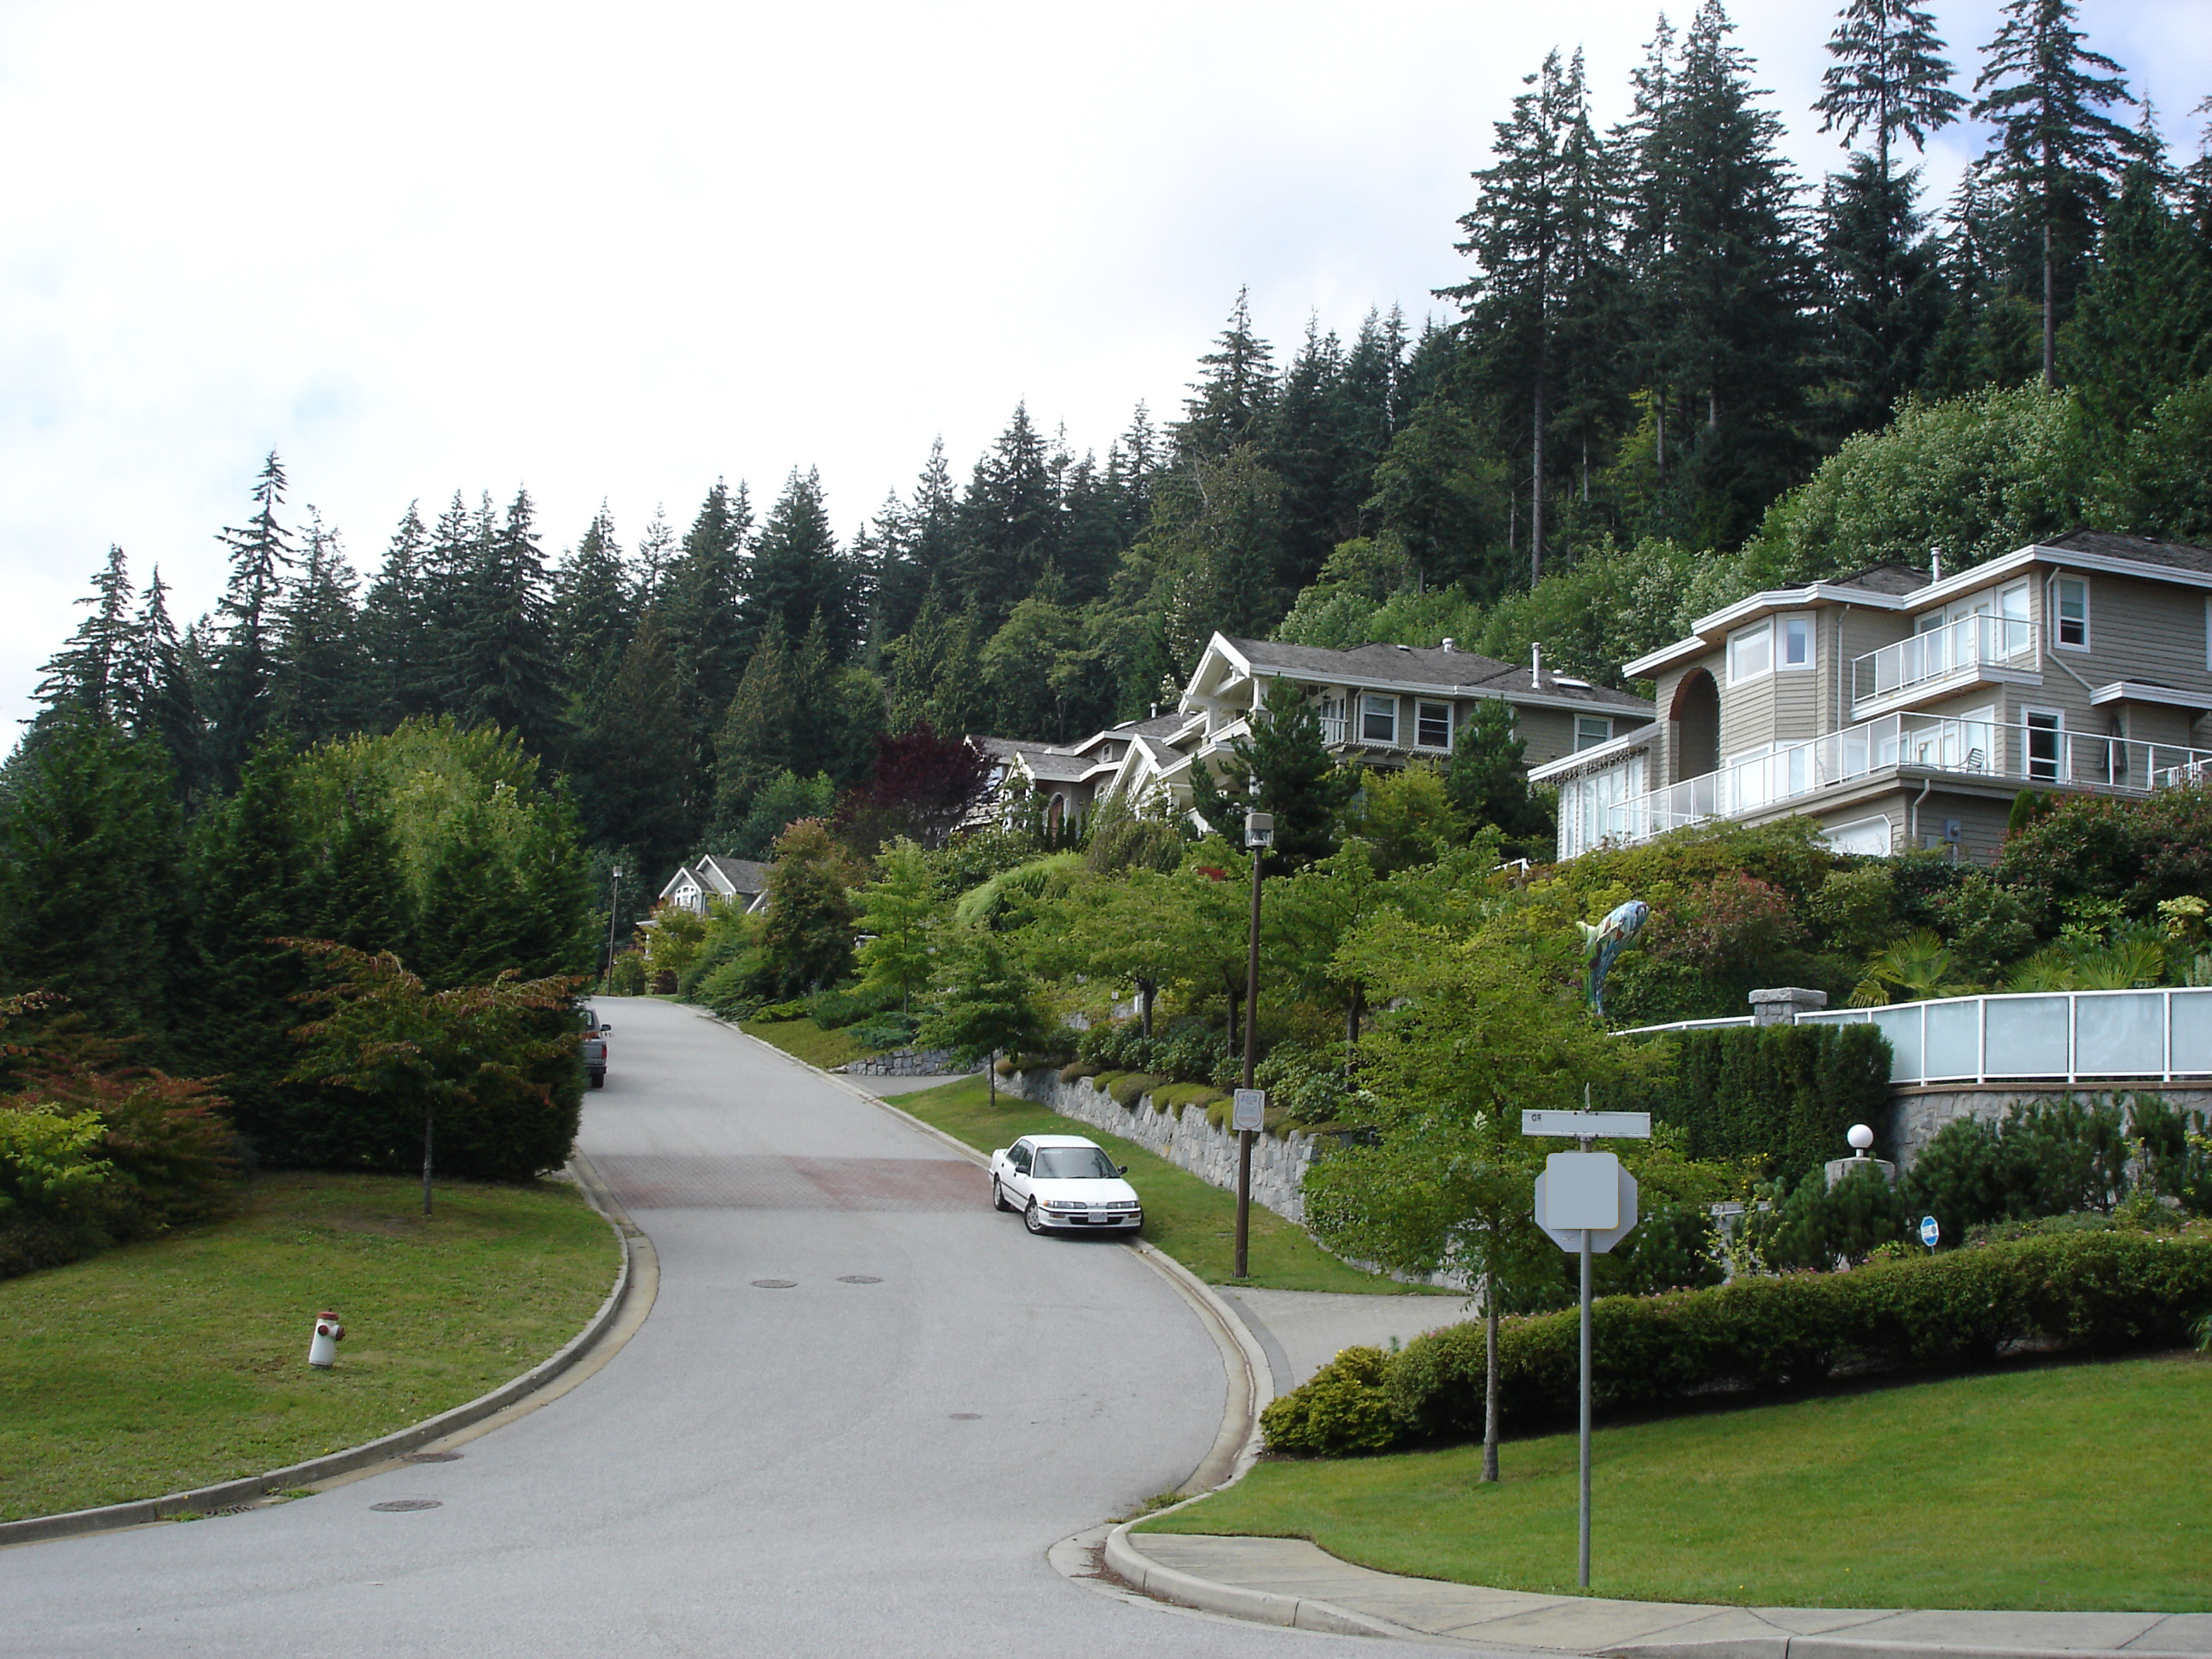
Bill McKibben advocates using meaningful and “striking images that define your community” when representing the impacts of climate change. (McKibben: 2007, p.150) Our own research in communities in British Columbia also shows that people can respond quickly and positively to visualizations of their own community futures with climate change problems and solutions(refs: Sheppard et al., 2011; Cohen et al;, 201?).
So, it matters quite a lot that people can see climate change in their own backyard. As mentioned above, there are various ways to make climate change visible locally, though this is not yet common. Look for an upcoming blog on how we can make better use of visual media on climate change at the community level…..
References
Flint, A. (2009) ‘Survey reveals details of climate action in the West’, Lincoln Institute of Land Policy Newsletter, 10 December, available at: http://atlincolnhouse.typepad.om/pressroom/2009/12/index.html
McKibben, B. (2007) Fight Global Warming Now, Holt Paperbacks, New York.